File:Eastern Cape 2001 dominant language map.svg

Size of this PNG preview of this SVG file: 800 × 526 pixels. Other resolutions: 320 × 210 pixels | 640 × 421 pixels | 1,024 × 674 pixels | 1,280 × 842 pixels | 2,560 × 1,684 pixels | 1,233 × 811 pixels.
Original file (SVG file, nominally 1,233 × 811 pixels, file size: 1.5 MB)
Summary
| Description |
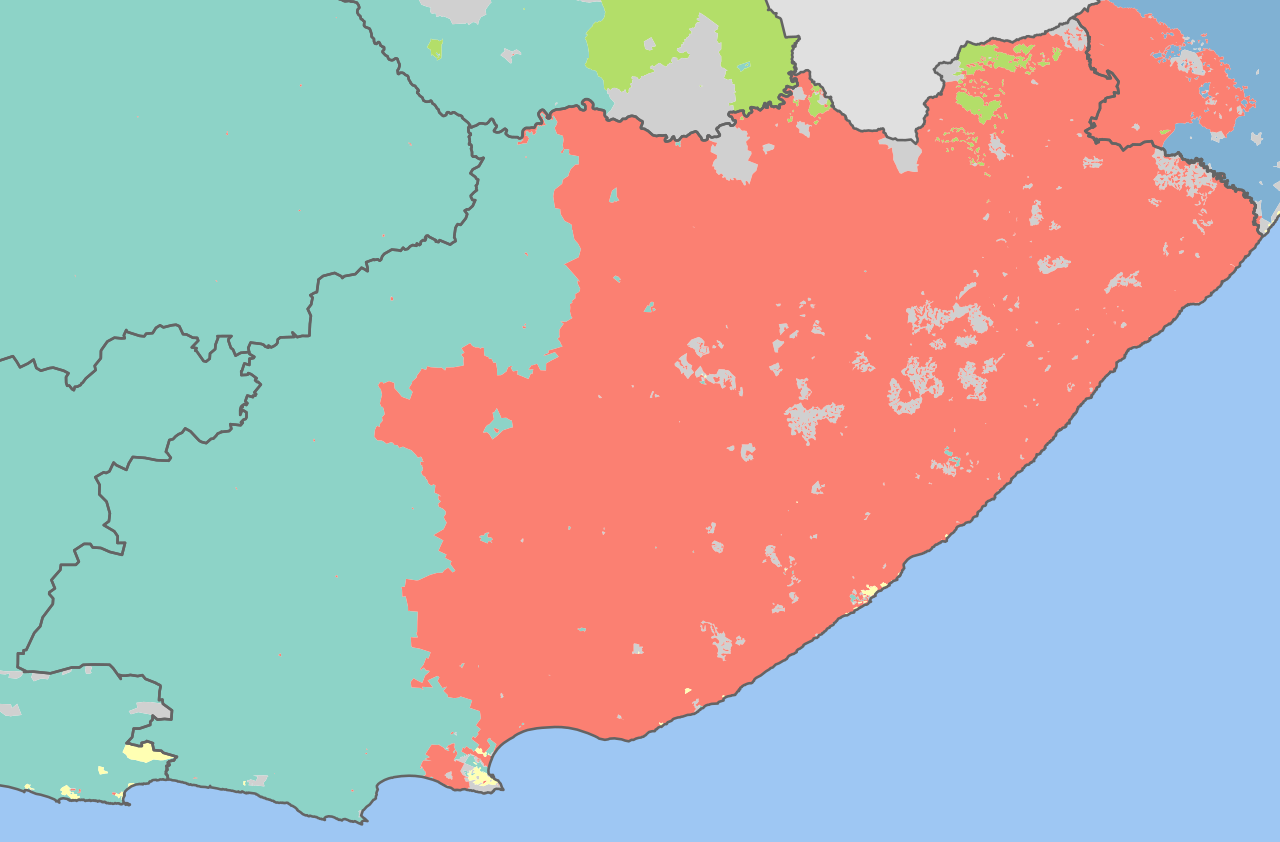
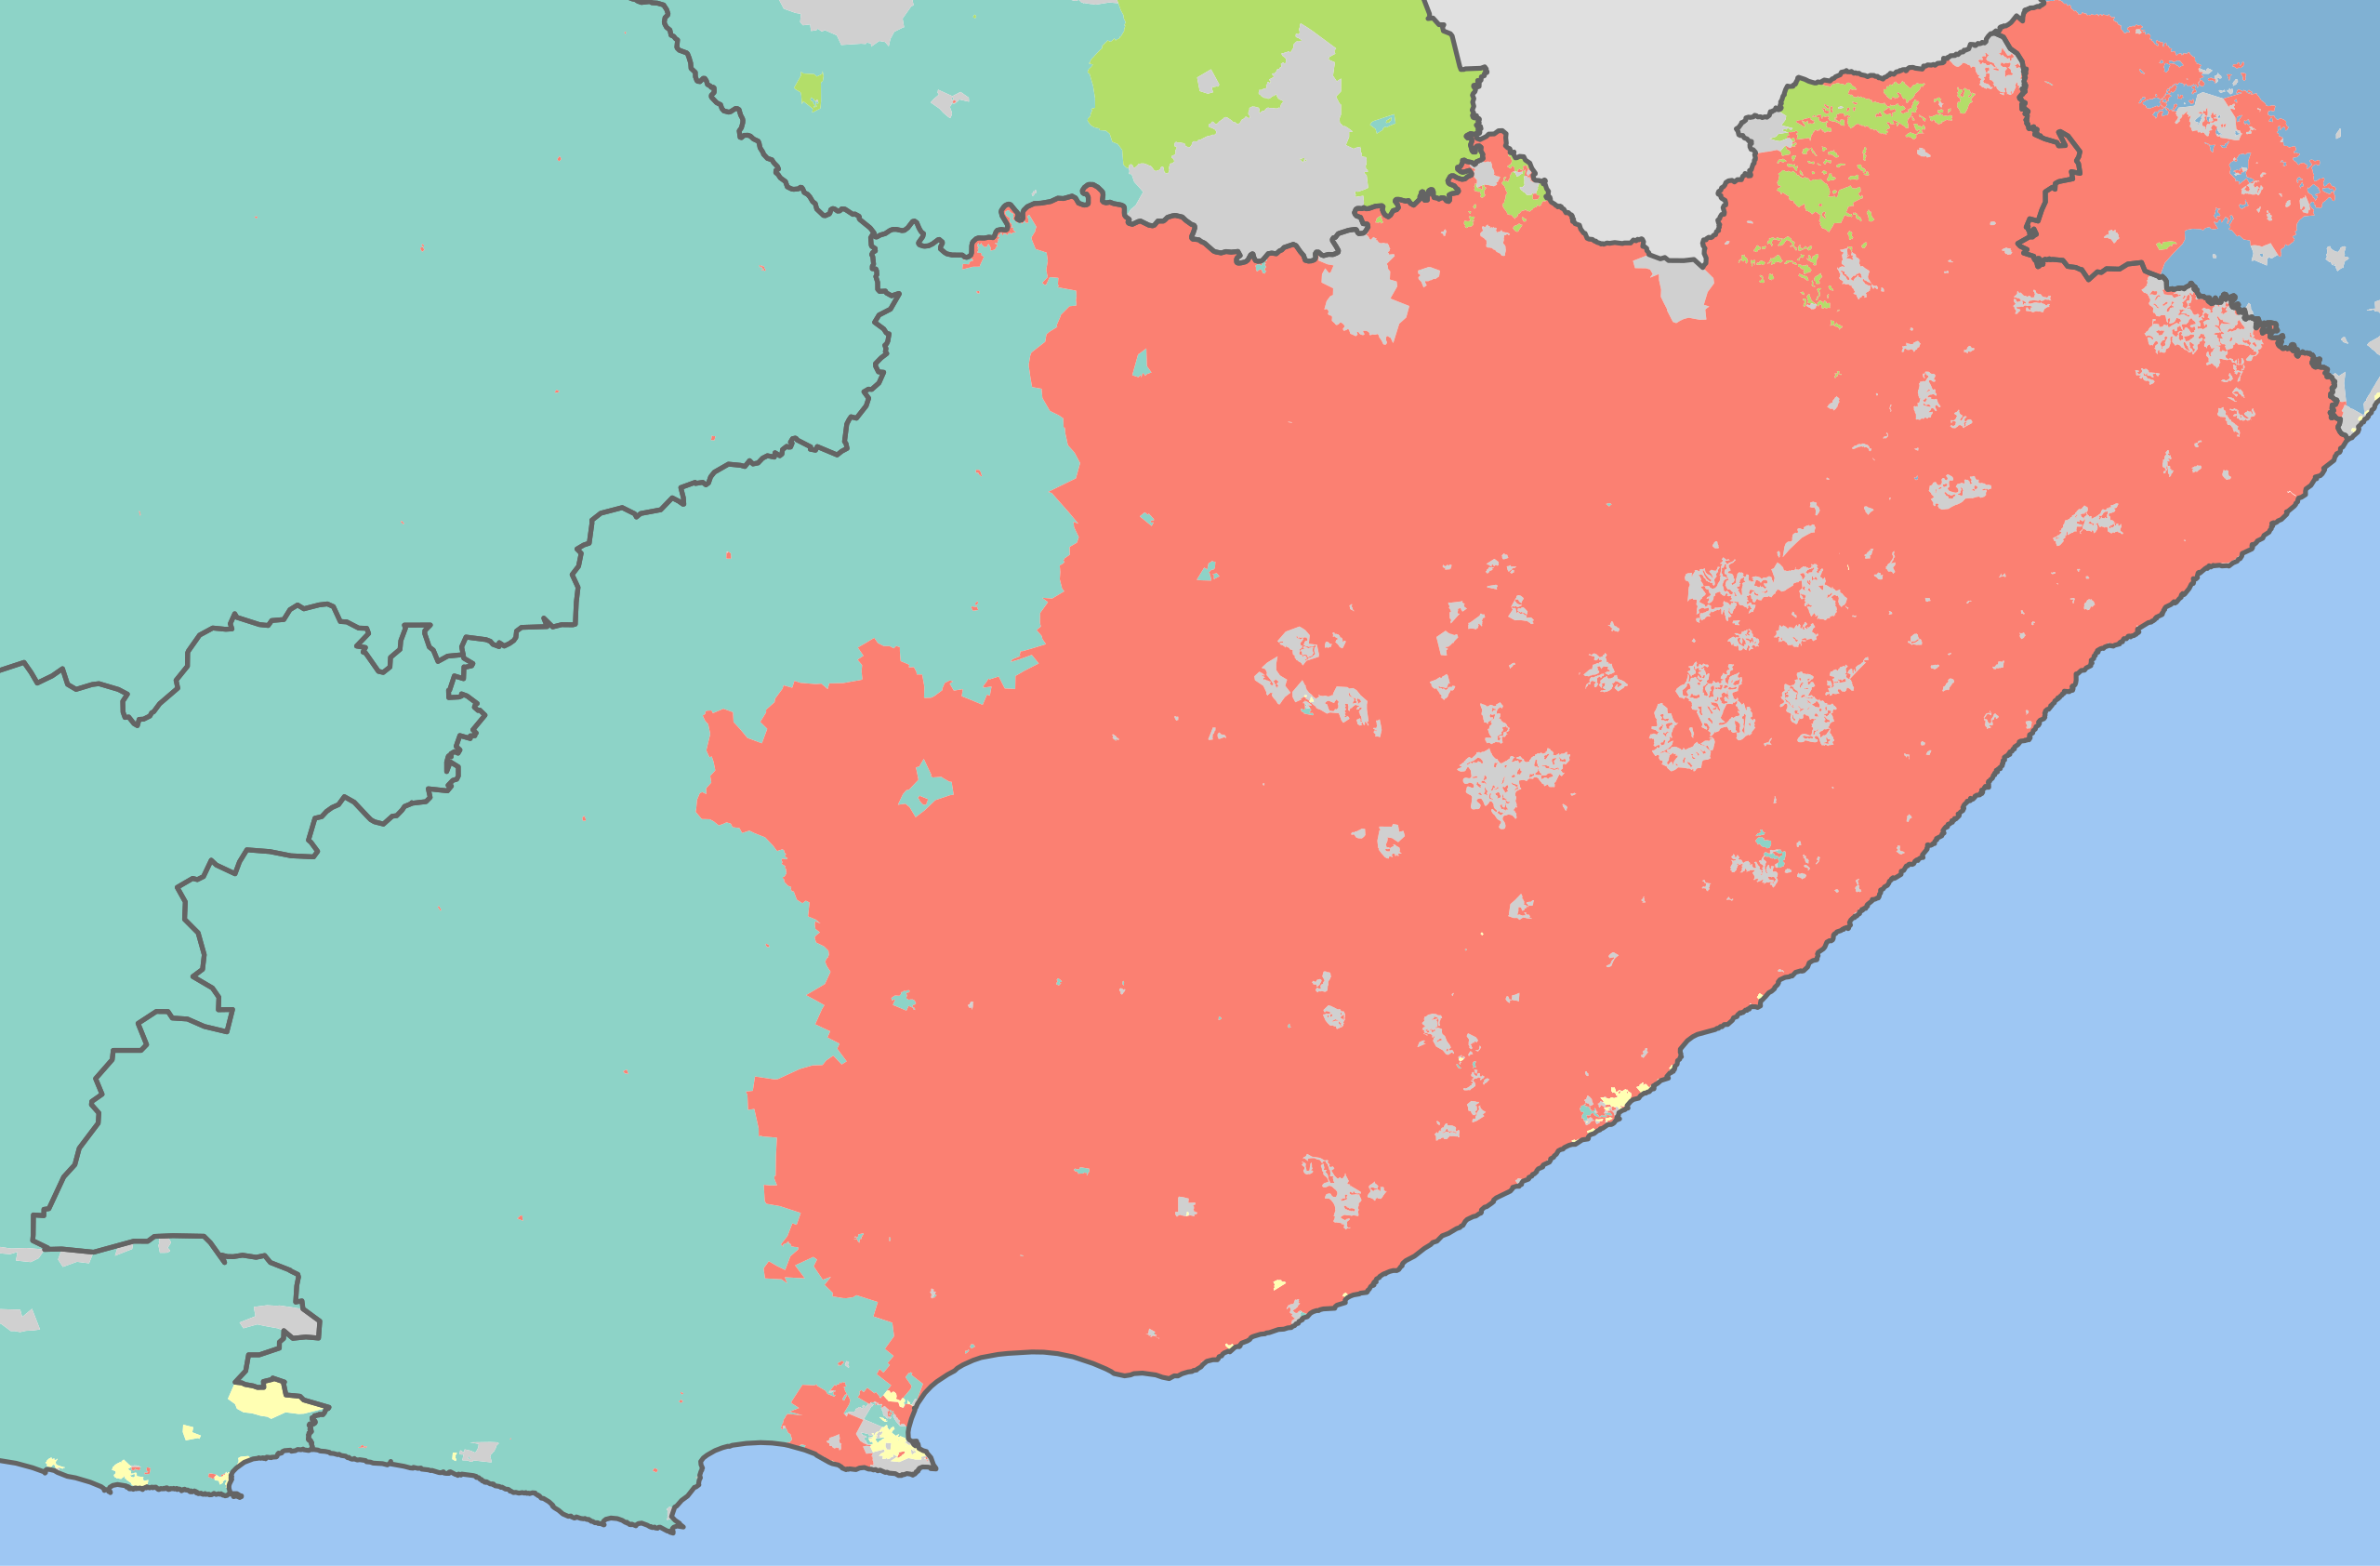
English: Map showing the dominant home languages in the Eastern Cape province of South Africa, according to Census 2001 at the "Subplace" level. In this context, a language is dominant if it more than 50% of the population in an area speak it at home, or more than 33% speak it and no other language is spoken by more than 25%.
Afrikaans
English
isiXhosa
isiZulu
Sesotho
No language dominant |
| Date | |
| Source | Statistics South Africa's Census 2001 is the source of the basic population data. The map results from my own processing of the data. |
| Author | Htonl |
Licensing
The following license applies to the population data on which the map is based:

|
The copyright holder of this file, Stats SA, allows anyone to use it for any purpose, provided that the copyright holder is properly attributed. Redistribution, derivative work, commercial use, and all other use is permitted. |
Attribution:
"the user acknowledges Stats SA as the source of the basic data wherever they process, apply, utilise, publish or distribute the data, and also that they specify that the relevant application and analysis (where applicable) result from their own processing of the data" [1]
|
The following tag applies to the map itself:
| I, the copyright holder of this work, release this work into the public domain. This applies worldwide. In some countries this may not be legally possible; if so: I grant anyone the right to use this work for any purpose, without any conditions, unless such conditions are required by law. |
File history
Click on a date/time to view the file as it appeared at that time.
| Date/Time | Thumbnail | Dimensions | User | Comment | |
|---|---|---|---|---|---|
| current | 05:47, 5 October 2010 | | 1,233 × 811 (1.5 MB) | Htonl | equal-area projection, map styling |
| 11:09, 16 February 2010 |  | 1,151 × 683 (4.89 MB) | Htonl | size | |
| 19:30, 15 February 2010 |  | 1,000 × 594 (4.68 MB) | Htonl | fix errors | |
| 21:39, 10 February 2010 |  | 1,000 × 594 (4.93 MB) | Htonl | =={{int:filedesc}}== {{Information |Description={{en|1=Map showing the dominant home languages in the Eastern Cape province of South Africa, according to Census 2001 at the "Subplace" level. In this context, a language is dominant if it more than 50% of t |
File usage
The following page uses this file:
Global file usage
The following other wikis use this file:
- Usage on af.wikipedia.org
- Usage on de.wikipedia.org
- Usage on en.wikipedia.org
- Usage on frr.wikipedia.org
- Usage on he.wikipedia.org
- Usage on hy.wikipedia.org
- Usage on ja.wikipedia.org
- Usage on ka.wikipedia.org
- Usage on ko.wikipedia.org
- Usage on ru.wikipedia.org
- Usage on zu.wikipedia.org